What Is DynamoDB? Ultimate Introduction for Beginners

Written by Rafal Wilinski
Published on April 11th, 2022
Time to 10x your DynamoDB productivity with Dynobase [learn more]
What is DynamoDB?
DynamoDB is a fast NoSQL Database developed and fully managed by Amazon Web Services (AWS). It's often referred to as a key-value store, but DynamoDB offers much more than that, including Streams, Global and Local Secondary Indexes, Multi-region and Multimaster replication with enterprise-grade security and in-memory caching for big scale.
Unlike traditional RDBMS databases, you don't have to provision a "database" or underlying machines. All you need to do is create a table and start writing and reading data from it. It's web-scale and production-ready right from the start.
DynamoDB is a perfect choice for Serverless applications because it follows the pay-what-you-use model and integrates perfectly with AWS Lambda and other services from AWS.
Why Use DynamoDB?
DynamoDB is one of, if not the most popular NoSQL databases available in the market today. It is gaining popularity amongst developers due to its ability to scale from handling ten transactions per second to thousands of transactions per second without any additional code level changes on the application. This flexibility allows developers to build their applications without worrying about the database's scalability once the application starts scaling.
DynamoDB brings many benefits over traditional relational databases or even self-hosted databases. Its ability to handle large workloads with numerous concurrent requests allows developers to design applications of any scale with managed database service.
It also brings in native capabilities that make DynamoDB a perfect option for developers:
- Access Control Rules: DynamoDB allows access restrictions, thus reducing unnecessary access to the database while only allowing specific services to connect to the required databases.
- Event Stream Data: This feature allows users to receive information regarding item-level changes to the database.
- Time to Live: DynamoDB natively supports removing items that exceed a specific time frame. This feature helps implement data retention for the items stored within the database.
- Data Redundancy: DynamoDB allows users to replicate their data across different geolocations. This replication provides redundancy to the data in case an AWS data center becomes unavailable.
Table of Contents
- Key Facts
- History
- Anatomy
- Latest Updates & Feature Releases
- When To Use
- When Not To Use
- 12 Biggest Misconceptions
- 7 Frequently Asked Questions
- Resources
Amazon DynamoDB - Key Facts
| Model | Key-value Store, Document |
| Website | aws.amazon.com/dynamodb/ |
| Type | NoSQL |
| Developed by | Amazon |
| Initial Release Date | January 18, 2012 |
| Cloud-based | Yes, fully managed, no servers to provision or manage |
| Runnable locally | No (technically yes, but only for test and dev purposes) |
| Open Source | No |
| Data scheme | Schema-less |
| SQL Support | Generally no, possible via AWS Athena |
| API | Yes, RESTful HTTP API |
| Supported Languages | Javascript, Typescript, Java, C# (.Net), Go, Php, Python, Ruby, Perl, Haskell, Erlang |
| Stored Procedures | No |
| Triggers | Yes, Streams |
| Consistency | Eventual |
| Mult-master | Yes |
| Multi-region | Yes |
| Transactions support | Yes, ACID |
| Backups | Yes, including point-in-time without downtime |
| Monitoring | Yes, with CloudWatch |
| Capacity modes | Provisioned (with optional scaling), On-Demand |
| Encryption | Yes, using KMS customer or AWS managed |
| Scalability | Yes, up to 10 trillion requests per day and 20M requests per second |
| Caching | Yes, possible using DynamoDB Accelerator (DAX) |
DynamoDB's History
With its gaining popularity in the early 2000s, Amazon.com turned to traditional relational databases to keep the enormous amount of data required by its services to keep the operations running smoothly. However, it involved multiple services having direct access to each other's databases. As a result, Amazon moved to API centric access pattern and eliminated the requirement of directly accessing different databases. However, the bottlenecks of using third-party relational databases proved too much when several technologies crashed due to the increased loads.
In 2007, Amazon proposed a new, innovative solution to resolve all their problems. The idea presented within the Amazon publication expresses the first-ever traces of the highly available key-value storage system capable of catering to the millions of requests seen during peak operating hours.
After years of development, Amazon released the first version of the DynamoDB in 2012. This managed database service was able to handle intense and demanding workloads while scaling up according to the requests processed by the application.
Over the years, DynamoDB has seen many different releases, improving the features and flexibility needed for customers. Today, DynamoDB is one of the most used non-relational databases in the market due to its reliability, rapid response times, and high availability.
Anatomy of DynamoDB
Data in DynamoDB is arranged into "Tables". Each Table consists of "Items". Each "Item" consists of "Attributes".
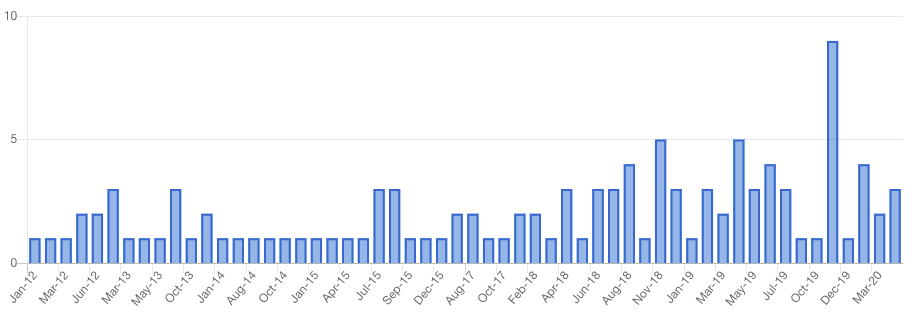
DynamoDB Updates & Feature Releases [2012 - Today]
When to Use DynamoDB
DynamoDB is a perfect choice for all sizes of applications, especially if your application needs predictable read and write performance. DynamoDB thanks to automatic scaling is able to survive the biggest traffic spikes. Moreover, the costs of DynamoDB are very predictable.
DynamoDB can be used for almost anything, including:
- Simple key-value store like metadata store
- Relational data store (Using Adjacency List Pattern \ Single Table Design)
- Geographical data, using Geohashing
- Timeseries, using multiple tables per period
- Caching (even more efficient with DAX)
- Event-driven transaction processing (thanks to DynamoDB Streams)
- Session store/history with TTL (time-to-live)
- Leaderboards
- Shopping carts using Transactions
- Workflow engines
- Relationship graph data stores (Using Adjacency List Pattern)
Moreover, when choosing the database for your next project, you should award a few extra points to DynamoDB if:
- You want to go Serverless. DynamoDB integrates with AWS Lambda and other AWS Serverless offerings really well
- You are going to deal with massive traffic with erratic spikes
- You want to be asynchronous and event-driven
- You want to minimize your costs and scale them ideally with your application usage
Read more about Top DynamoDB Pros & Cons.
When Not to Use DynamoDB
Even though DynamoDB can be used for almost anything you can imagine, there are some cases when you shouldn't use it.
- If your software is running outside of AWS Cloud, like inside other cloud or on-premise, you might consider storing your data closer to your application in order to minimize latency between database and service.
- ~If you need to use SQL capabitilies.~ With PartiQL, this is now possible!
- If you need to run ad-hoc queries on whole dataset, you might consider replicating DynamoDB data to Redshift or other relational database
12 Biggest DynamoDB Misconceptions
1. It's a NoSQL Database so It's Not Suitable for Relational Data
A common misconception I often hear about DynamoDB is that because it's NoSQL and does not support JOINs like traditional relational databases, it is not suitable for relational data. Well, modeling relationship is perfectly doable in DynamoDB.
he two most common approaches use AWS Amplify, which provides all AWS resources, including tables and resolvers, and a single-table design, which uses only one table to fit all data entities into one container and smart keys composition. While I highly recommend the former to get started and for smaller projects, the latter is more "professional" and officially recommended by AWS. If you want to learn more about single-table design, you can learn about it from Alex's DeBrie book about DynamoDB.
In fact, DynamoDB is suitable for almost all types of data. It makes a perfect key value store, metadata store, relational database, event store (e.g. in Event Sourcing) and transactional data store - thanks to transactions support.
2. DynamoDB Is Slow
Anoher argument is about the speed. Many times I've heard that developers can fetch data from their relational databases in less than 1ms! And DynamoDB? Same operation takes 10ms or even 20ms, it's too slow, right?
Not really. These scenarios are often based on an oversimplified setups where the speed is measured by fetching one row by an indexed field and on a beefy machine without traffic, erratic spikes and a myriad of other factors. Reality is often a lot messier, especially at scale. As your relational database starts getting more and more traffic, you'll encounter slowdowns related to the load on the machine caused by other operations and processes, connection pool exhaustions, transaction conflicts, and so on.
What about DynamoDB in such conditions? The performance is always the same. No matter if you're sending 1 request per second, or 1,00,000 requests per second, DynamoDB (if data model has been architected correctly), behaves great, sometimes even better under heavy load.
Source: Amazon DynamoDB auto scaling: Performance and cost optimization at any scale
3. DynamoDB Is Expensive
Comparing to traditional, non-managed databases, it's much cheaper to scale. Actually, DynamoDB costs are super predictable and directly proportional to the usage. In traditional, non-managed databases, the TCO (Total Cost of Ownership) is much more non-linear and has a lot of hidden costs that might be not visible at first glance:

At the beginning, on a small scale, DynamoDB costs are close to zero since if there's no traffic, there are no costs. Moreover, AWS offers quite generous Free Tier so you might even go to the production with zero database costs. In a non-managed database, you need to provision a VM/Machine/Instance with at least 1 vCPU. That's a hard cost you cannot skip and you're paying it even if your database is completely unused.
Later on, your provisioned database might outperform DynamoDB in terms of costs but at some point you'll encounter a point where current machine will be not enough. You will find yourself in a constant struggle of bumping the specification, investigating transient and hard to debug problems, or tweaking not-so-well documented variables. At some point, you might even consider hiring a dedicated specialist with a hefty pay to deal with these problems for you.
At the same time, DynamoDB requires zero supervision or fine-tuning. It simply works. And while that sometimes it might seem more expensive, you're actually saving a lot of money (and time!) by not having to worry about operational issues, managing backups, and having constant throughput and 99.99% SLA.
Remember, always compare TCO, not just pure cost of running VMs/machines/containers.
4. DynamoDB Is Schemaless
That's actually not a misconception. Although DynamoDB is giving users freedom of items shape - they don't have to conform to any schema since DynamoDB is schemaless, lack of any validation or convention might lead to a huge mess.
However, if you're going to design your data model according to single-table design, you're going to have a really strict set of usable access patterns which essentially will become your schema.
5. DynamoDB Is Hard to Use
Every technology requires some investment and DynamoDB is no exception. However, because DynamoDB API is very minimal (DocumentClient has only 11 operations), the scope of the material to become an expert might be a lot smaller compared to learning PostgreSQL or Elasticsearch. Furthermore, there are books about just running and maintaining these two databases. In DynamoDB that problem simply does not exist. It's ran by Amazon for you and you don't need to worry about it.
You might also argue that lack of SQL support is a blocker. Up until recently, without support for PartiQL, this statement was true but right now, you can use it. However, if you want to use native query language, we've prepared a visual query builder which might help you getting started.
Moreover, the ecosystem of DynamoDB is constantly growing. There are more and more tools providing useful abstractions like DynamoDB Toolbox by Jeremy Daly for working with single-table design, Dynamoose for ORM-like experience, AWS Amplify which hides the DynamoDB layer from the programmer completely, or Dynobase which helps you in navigating between profiles, regions, tables and exploring datasets.
Lastly, DynamoDB integrates with the rest of the AWS ecosystem seamlessly reducing the amount of code you'd need to create. Mechanisms like TTL, Point in Time recovery, streaming, global replication are built into it. Your responsibility is just to use them, not author them.
6. Cannot Use SQL with DynamoDB
This statement was true until some time ago. Recently, AWS announced PartiQL support for DynamoDB. With PartiQL, an SQL-like language, you can use familiar language to interact with DynamoDB and other AWS' components like Athena.
Keep in mind that using SQL is not removing DynamoDB's technical limitations. You still need to understand that your SELECT * FROM ... queries will be translated to scans or queries, that things like UPDATE X WHERE Y probably is not going to work, or that COUNTing is also not permitted.
7. Only Suitable for Serverless Workloads
DynamoDB is very often being composed into Serverless-based architectures. In fact, it is a perfect match because just like AWS Lambda, S3, and other managed services, it is billed for the actual usage of it - per amount of read / write operations and gigabytes of disk space your tables consume.
That being said, it is not blocking you from using DynamoDB with non-Serverless workloads. Tables can be accessed from any environment, including EC2 instances, CI/CD systems, VMs, containers, on-premises or even your local machine. All you need to is to have a valid AWS identity with credentials scoped to allow accessing it. With that in place, you can use CLI or SDKs to interact with DynamoDB.
8. DynamoDB Is Hard to Manage
Totally untrue. No, it's all managed for you. Once you click "Create Table" in the AWS Console, you get a highly available, redundant, scalable, encrypted both at rest and in transit, SOC, PCI and HIPAA compliant database within seconds. Imagine how hard that would be to achieve the same result using on-premise software.
But, wait there's more. With DynamoDB, you can enable cross-region replication with sub-second latency, start streaming data from it to other data sources or data processors, or enable PITR (Point in Time Recovery) with a single API call. How cool is that? And once again, how much harder that would be using non-managed software?
Essentially, DynamoDB allows you to build product on a shoulders of giants allowing you to focus on what's important for your business, on your core competency. Friends don't let friends run databases on instances/VMs/containers/on-premises.
9. DynamoDB Is Secure by Default
Just like any other database or service, DynamoDB is just a tool. While it has been built with the best security principles in mind, including encryption, IAM, working backups, it's up to you how you're going to use it. Shared responsibility model is key here.
While Amazon ensures the best "security of the cloud", you're still responsible for the "security in the cloud". No one is going to prevent you from storing passwords in plaintext, using wildcard IAM policies, leaking your AWS identity credentials or violating laws and regulations.
DynamoDB actually makes the security of your database easier. Because there are no servers, containers, VMs or clusters to manage, you don't have to worry about restricting network access correctly, patching software regularily, or being up-to-date with latest vulerabilities.
10. DynamoDB Cannot Be Used for Serious Projects
That's simply not true. There's a number of really serious companies using DynamoDB in production including Duolingo, an online learning site, uses DynamoDB to store approximately 31 billion data objects on their web server, Nike, who ditched their Cassandra cluster in favor of DynamoDB, or Disney that uses DynamoDB to store metadata of billions of customer actions.
DynamoDB is also dogfood by Amazon internally - it is a Tier-0 service powering most of Amazon. It is also highly advised for all new initiatives at Amazon to use DynamoDB as the database.
11. DynamoDB Is Suitable only for Big Projects with Huge Traffic
False! Thanks to free tier, you can start using DynamoDB completely for free. After that, the usage costs are scaling as you go. The more clients you get, the more money you earn, the bigger DynamoDB costs are and everything is proportional. Moreover, there's no initial commitment like in other non-managed databases where the entry instance starts with 10USD / month.
12. DynamoDB Is Bad for Analytics
The last point is a bit more complicated. It is true that because you cannot run arbitrary queries against DynamoDB tables (technically speaking you can but it's extremely inefficient due to Scan nature), you cannot perform ad-hoc reports of your data. That might be disappointing. However, there are solutions to that:
You can stream your data from DynamoDB to Redshift or some other relational database built for reporting and analytics purposes
You can build aggregation functions on your own. These functions plugged to the DynamoDB Streams will be automatically recalculating your composite statistics or rollups providing always the most up-to-date state of some aggregate.
Frequently Asked Questions
Is DynamoDB SQL or NoSQL?
DynamoDB is a NoSQL key-value-based, fully managed database that allows users to store unstructured data in a JSON format.
Is DynamoDB document-based?
DynamoDB provides the ability to store JSON documents within an attribute in the database and allows users to update individual attributes within the document.
Is DynamoDB a relational database?
No, DynamoDB is not a relational database. Instead, DynamoDB is a non-relational, key-value-based, fully managed NoSQL database service provided by AWS.
What type of database is DynamoDB?
DynamoDB is a non-relational, key-value, and document-based, NoSQL fully managed database service provided by AWS. It is capable of handling a multitude of concurrent requests without compromising speed.
How is data stored in DynamoDB?
DynamoDB stores its data in partitions. A partition is a space allocated for a table running on SSDs (Solid State Drives) and automatically replicates amongst multiple AWS availability zones. It is important to note that users do not have to worry about managing these partitions. The database splits the data into partitions according to the partition key defined.
How resilient is DynamoDB?
Data stored within DynamoDB is highly resilient, with the DynamoDB natively supporting the following features:
- On-demand backup and restore: DynamoDB supports on-demand full backups of tables for long-term archival and retention capabilities.
- Point-in-time recovery: This feature enables users to protect DynamoDB tables from accidental deletion or write operations. It allows restoring tables to any point in the last 35 days.
- Multiple Availability Zones: This feature allows almost real-time data replication in multiple availability zones to protect them in the event of a catastrophic data center failure.
Is DynamoDB good for unstructured data?
No, DynamoDB is not a good fit for storing unstructured data. Instead, DynamoDB allows users to efficiently and efficiently store structured data.