
Manage tables / NEW IN 3.0
Watch what your table is doing.
Inspect CloudWatch metrics, tail DynamoDB Streams, or refresh your data grid automatically. Choose the view that matches the question you are investigating.
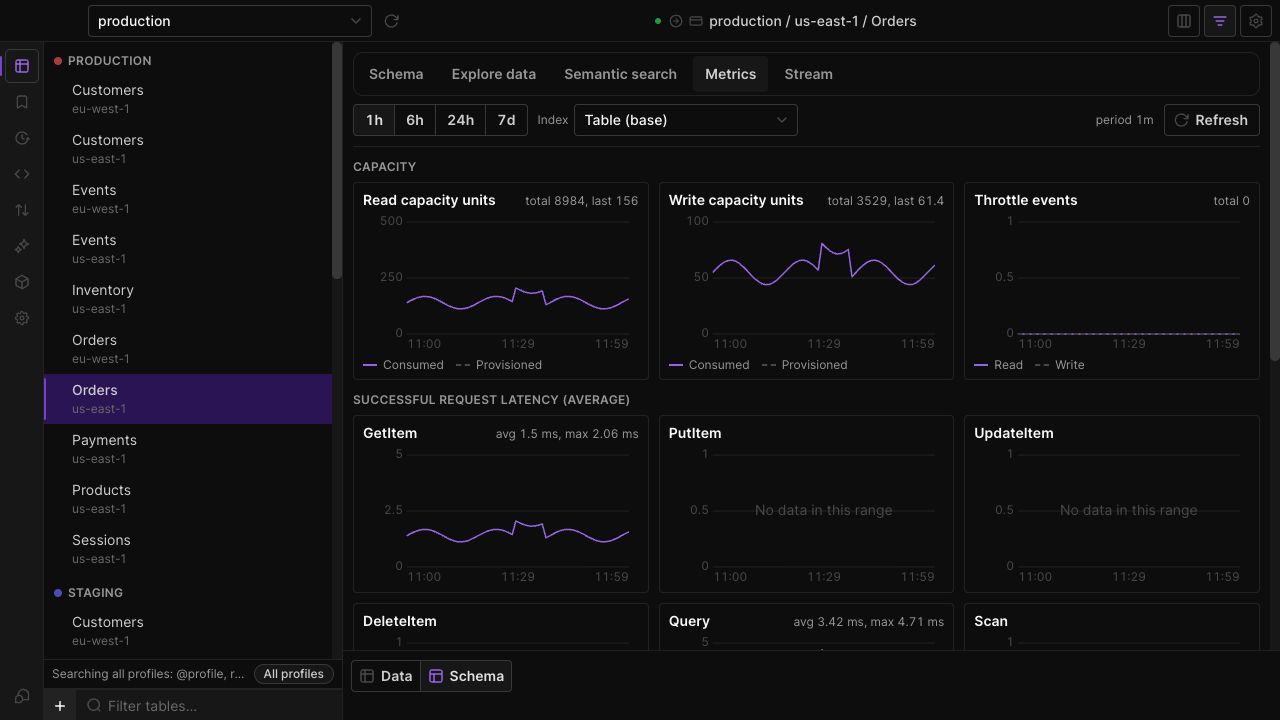
Read the table's metrics
Open the Metrics tab to inspect capacity usage, throttling and latency. Choose a time range and supported index scope.
Follow item events
Use the Stream tab to start and pause a tail, filter event types and inspect available old and new item images.
Keep query results current
Enable auto-refresh for a data view when you need periodic updates. Read capacity and scanned counts remain visible in the footer.
IN THE APP
How it works
Open Dynobase and follow these steps to use metrics, streams and live refresh.
- 01
Pick your view
Open Schema and choose Metrics for service measurements or Stream for item change events.
- 02
Set the scope
Choose a metrics range or stream position and filters. Start the stream tail explicitly when ready.
- 03
Inspect and pause
Review chart points or event details. Pause the tail or disable auto-refresh when the investigation is finished.