
DynamoDB Throttling: Why It Happens and How to Fix It

Written by Chameera Dulanga
Last updated: October 23rd, 2026
DynamoDB throttles a read or write when serving it would exceed one of four limits: the capacity you provisioned, the maximum throughput you set on an on-demand table, the per-table throughput quota, or the throughput of a single partition (3,000 read units and 1,000 write units per second). A throttled request fails with an HTTP 400 error, which the AWS SDKs retry automatically. Since August 2025 every throttled request carries a ThrottlingReasons list that names the limit and the table or index, and CloudWatch has a metric for each cause, such as WriteKeyRangeThroughputThrottleEvents for a hot partition.
The four causes of DynamoDB throttling
| Limit type | What it means | Capacity mode | Exception | CloudWatch metrics |
|---|---|---|---|---|
ProvisionedThroughputExceeded | Traffic is above the table's or GSI's provisioned read or write capacity, and burst capacity is used up | Provisioned | ProvisionedThroughputExceededException | ReadProvisionedThroughputThrottleEvents, WriteProvisionedThroughputThrottleEvents |
KeyRangeThroughputExceeded | One partition is receiving more than 3,000 read units or 1,000 write units per second | Both | ProvisionedThroughputExceededException (provisioned) or ThrottlingException (on-demand) | ReadKeyRangeThroughputThrottleEvents, WriteKeyRangeThroughputThrottleEvents |
MaxOnDemandThroughputExceeded | Traffic is above the maximum throughput you configured on an on-demand table or GSI | On-demand | ThrottlingException | ReadMaxOnDemandThroughputThrottleEvents, WriteMaxOnDemandThroughputThrottleEvents |
AccountLimitExceeded | An on-demand table or GSI is above the per-table throughput quota (40,000 read and 40,000 write request units by default) | On-demand | RequestLimitExceeded | ReadAccountLimitThrottleEvents, WriteAccountLimitThrottleEvents |
Each reason is built as Table or Index, then Read or Write, then the limit type, so you get values such as TableWriteKeyRangeThroughputExceeded or IndexReadProvisionedThroughputExceeded. The resource field holds the ARN of the throttled table or index. The older metrics ReadThrottleEvents, WriteThrottleEvents and ThrottledRequests still exist and count every cause together.
The legacy event metrics count items, not calls: a BatchGetItem that reads 10 items is processed as 10 read events, so ReadThrottleEvents can rise while ThrottledRequests goes up only if all 10 are throttled.
Find out which limit you hit
In your code
With retries enabled, the SDK retries eligible throttled requests with backoff before surfacing the final exception. The attempt count depends on your SDK and retry configuration. The reasons come with the exception. You need an SDK version released after August 2025 to see them, and note the field name: ThrottlingException uses throttlingReasons, while ProvisionedThroughputExceededException and RequestLimitExceeded use ThrottlingReasons.
In Python the reasons are in the parsed error response:
The adaptive retry mode adds client-side rate limiting on top of backoff, which helps a batch job slow itself down instead of hammering a throttled table. The error pages for ProvisionedThroughputExceededException and ThrottlingException cover the messages in more detail.
In CloudWatch and the console
Graph the eight per-cause metrics above for the table and for each GSI (use the TableName and GlobalSecondaryIndexName dimensions). The DynamoDB console also graphs throttle events broken down by cause. Set alarms on the KeyRange and AccountLimit metrics in particular, because neither is fixed by adding provisioned capacity.
To find the partition keys behind key-range throttling, turn on CloudWatch Contributor Insights for the table. Its THROTTLED_KEYS mode reports only throttled keys, and while nothing is being throttled it ingests no data and costs nothing, so you can leave it on. The default mode, ACCESSED_AND_THROTTLED_KEYS, also ranks the most-accessed keys.
If you work in Dynobase, its Metrics tab shows a table's capacity usage, throttling and latency from CloudWatch next to the data, for the table or a supported index.
Hot partitions: KeyRangeThroughputExceeded
Every partition of a table or GSI serves at most 3,000 read units and 1,000 write units per second, in both capacity modes. A table can have plenty of total capacity and still throttle when the traffic lands on one partition key. Item size counts: a 20 KB item costs 5 read units for each strongly consistent read, so a single hot item tops out at about 600 such reads per second. The capacity and item size calculator shows how many units an item costs.
DynamoDB adapts to many hot partitions on its own. Its split-for-heat mechanism moves a busy key range onto new partitions, and adaptive capacity can isolate a single hot item on a partition of its own, at no charge. Detecting and adapting takes several minutes, there is no notification, and splitting can't help in three cases:
- One hot item. An item can't be split, so it is capped at 3,000 read units and 1,000 write units per second.
- Ever-increasing sort keys under one partition key, such as timestamps written to
device#42. Every write lands at the end of the key range, so splitting doesn't spread them and the key stays near 1,000 write units per second. - Tables with a local secondary index. Item collections can't be split across partitions, so one partition key value is always served by one partition.
What to do, roughly in the order AWS suggests:
- Find the key with Contributor Insights in
THROTTLED_KEYSmode. - Read less from it. Eventually consistent reads cost half the read units of strongly consistent ones, and a cache such as DAX absorbs repeated reads of the same items.
- Pre-warm before a known peak. Raising a table's or GSI's warm throughput gets the partitions ready before a launch or migration instead of during it.
- Spread the writes. Add a suffix to a hot partition key (
customer#123#0tocustomer#123#9) and read the shards back in parallel, or aggregate high-frequency updates such as counters before writing them. Choosing the partition key covers the patterns. - Check your GSIs. A GSI whose key has few distinct values (
status = ACTIVE) throttles on its own partitions, and a throttled GSI throttles writes to the base table, because every base-table write must also update the index. Use a higher-cardinality GSI key; since November 2025 a GSI key can combine up to four partition-key and four sort-key attributes.
Provisioned tables: ProvisionedThroughputExceeded
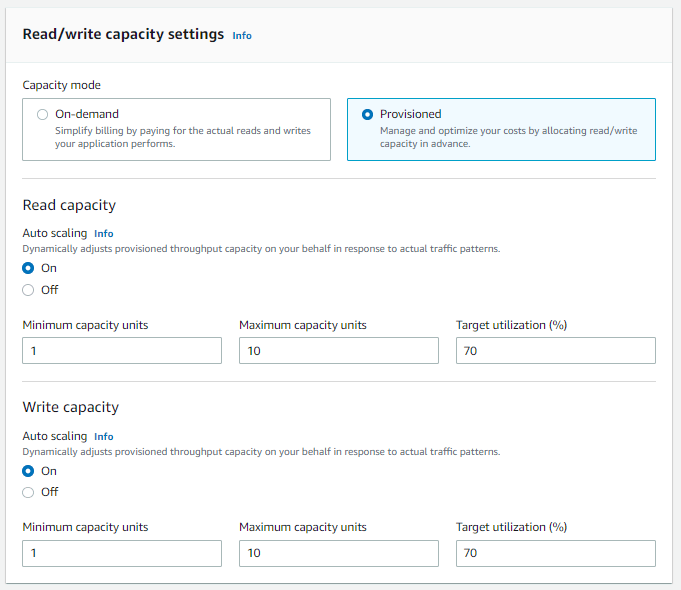
A provisioned table throttles when consumed capacity stays above its provisioned capacity per second. Two mechanisms soften this, and both have limits:
- Burst capacity. DynamoDB retains up to five minutes (300 seconds) of unused read and write capacity and spends it on short spikes. AWS can also use it for background maintenance without notice, so treat it as a cushion, not as capacity.
- Auto scaling. Auto scaling raises capacity only after consumed capacity breaches the target utilization for two consecutive minutes, and spikes more than a minute apart might not trigger it. The
UpdateTablecall it makes then takes several minutes, and requests above the old capacity are throttled in the meantime. Scaling down happens after 15 consecutive data points below the target, and by default each table or GSI can be scaled down at most 27 times a day (4 decreases at any time plus 1 more for each hour without one).
Auto scaling therefore handles traffic that ramps over minutes, not sudden spikes. For a spike you can predict, raise the minimum capacity beforehand. For traffic you can't predict, use on-demand mode: since August 2025 you can switch a table from provisioned to on-demand up to four times in a rolling 24 hours, and back to provisioned at any time. The on-demand vs provisioned comparison covers when each mode wins.
On-demand tables: when they still throttle
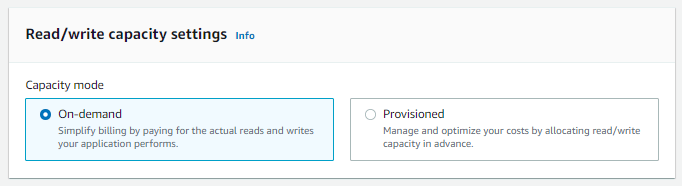
On-demand mode removes capacity planning, but not every limit:
- Sudden growth. A new on-demand table can sustain up to 4,000 writes and 12,000 reads per second. After that, a table instantly accommodates up to double its previous peak, and throttling can occur if traffic exceeds double the previous peak within 30 minutes. Pre-warm with warm throughput before a launch, a migration or a load test.
- The per-table quota. Each on-demand table and GSI is capped at 40,000 read request units and 40,000 write request units per second by default, which surfaces as
RequestLimitExceeded. Request a higher "Table-level read throughput limit" or "Table-level write throughput limit" in the Service Quotas console; since February 2025 these throughput increases are approved automatically within minutes. - Your own maximum throughput. If you set a maximum read or write throughput on the table or a GSI to cap cost, requests above it get
ThrottlingException. The cap is a target, not an exact ceiling, so short bursts can exceed it. - Hot partitions. The 3,000 and 1,000 units per second per partition apply exactly as they do in provisioned mode.
What happens to throttled requests
- The SDK retries them. Throttling errors are retryable HTTP 400 responses, and the AWS SDKs retry them with exponential backoff before giving up. Each retry adds latency, so heavy throttling shows up as slow requests before it shows up as errors.
- Unhandled write failures lose data. If retries run out and your code doesn't queue or retry the write, it never happens.
- Batch calls return leftovers instead of failing.
BatchWriteItemandBatchGetItemreturn throttled items inUnprocessedItemsorUnprocessedKeys, and throw only when nothing in the batch could be processed. Retry the leftovers with backoff, or they are silently dropped. - They don't count against the SLA. The DynamoDB SLA counts only HTTP 500 and 503 responses as errors.
Fixes by symptom
| What you see | Likely cause | Fix |
|---|---|---|
*ProvisionedThroughputThrottleEvents during traffic spikes | Capacity too low for the peak | Raise auto scaling minimums ahead of known peaks, or switch to on-demand |
*KeyRangeThroughputThrottleEvents while total capacity is idle | Hot partition key or hot item | Contributor Insights, eventually consistent reads, caching, write sharding |
*AccountLimitThrottleEvents on an on-demand table | Per-table quota of 40,000 units per second | Request a table-level throughput quota increase in Service Quotas |
*MaxOnDemandThroughputThrottleEvents | Your configured on-demand maximum | Raise or remove the maximum read or write throughput |
Base-table writes throttled with an Index... reason | A GSI can't keep up | Give the GSI a higher-cardinality key; in provisioned mode, give it enough write capacity |
| Throttling only right after launch or a migration | Table not yet scaled for the traffic | Pre-warm with warm throughput |
Frequently Asked Questions
What causes DynamoDB throttling?
ThrottlingReasons field on the error tells you which one.What does WriteKeyRangeThroughputThrottleEvents mean?
ReadKeyRangeThroughputThrottleEvents is the read equivalent, at 3,000 read units per second.Can an on-demand DynamoDB table be throttled?
Does DynamoDB retry throttled requests automatically?
UnprocessedItems or UnprocessedKeys, and you have to retry those yourself.What is the difference between ThrottlingException and ProvisionedThroughputExceededException?
ProvisionedThroughputExceededException comes from provisioned tables, either because the table or GSI ran out of provisioned capacity or because a partition hit its limit. ThrottlingException comes from on-demand tables that hit a partition limit or a configured maximum throughput, and from control plane calls made too quickly. RequestLimitExceeded means an on-demand table hit its throughput quota.Dynobase is a Professional GUI Client for DynamoDB
Start your 7-day free trial today
Product Features
DynamoDB Tools
- SSH GUI Client
- Chat With Cloud
- MongoDB GUI Client
- AWS Cost Monitoring
- DynamoDB Query Builder
- DynamoDB Code Examples
- DynamoDB Node.js Queries
- DynamoDB JSON Converter
- DynamoDB UUID Generator
- DynamoDB Local Admin GUI
- DynamoDB Pricing Calculator
- DynamoDB Single-Table Design
- Best DynamoDB GUI Clients
- Dynobase vs DynoTable